Reliability is an important prerequisite for accepting the quality of a test.
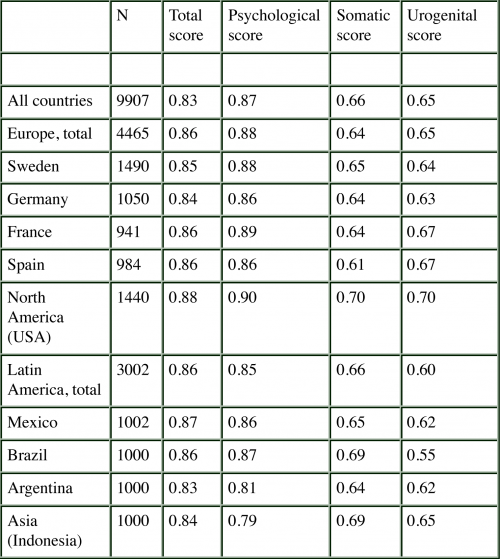
This table below demonstrates the reliability of the AMS across countries and cultures (measured with Cronbach’s Alpha). The consistency coefficients varied between 0.6 and 0.9 across countries for the total score, as well the three subscales.
In addition, the test-retest correlation coefficient (Pearson’s correlation) for the total score demonstrates high internal consistency. The test-retest coefficients of the total score was 0.9 for all countries combined.
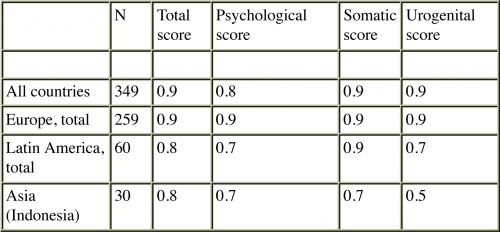
High correlation coefficients were also observed for the three domains across the regions studied. In the only Asian country we studied, Indonesia, the test-retest reliability is low (0.5). However, the assessments were based on small numbers, i.e., can be judged as preliminary information only 9, 10.
Altogether, the MRS passed all reliability tests with good results, i.e. certifying a good quality of measurement.
Evidence for validity is provided in a stepwise process.
Similar to reliability that assesses the consistency of measurement, the validity estimates if a QoL scale really measures what it intends to measure.
But whereas reliability can be determined straight forward with very few indicators, the validity is almost always a continuous process (construct validation). It is a process of accumulating evidence for a valid measurement of what is purposed.
There are various indicators for validity in the such as:
- Internal structure of the scale
- sub-score and total score correlations
- criterion-oriented validity (correlation with other scales),
- discriminative or prognostic validity
Internal structure of the MRS across countries
The first factorial analysis in 1996 was applied to identify the dimensions of the scale. Three dimensions of symptoms/complaints were identified 2: a psychological, a somato-vegetative, and a urogenital factor that explained 58.8% of the total variance.
A large, multinational survey in nine countries on four continents was analysed to answer the question: surprisingly similar factor loadings of the 11 items of the 3 domains of the MRS were observed (Table).
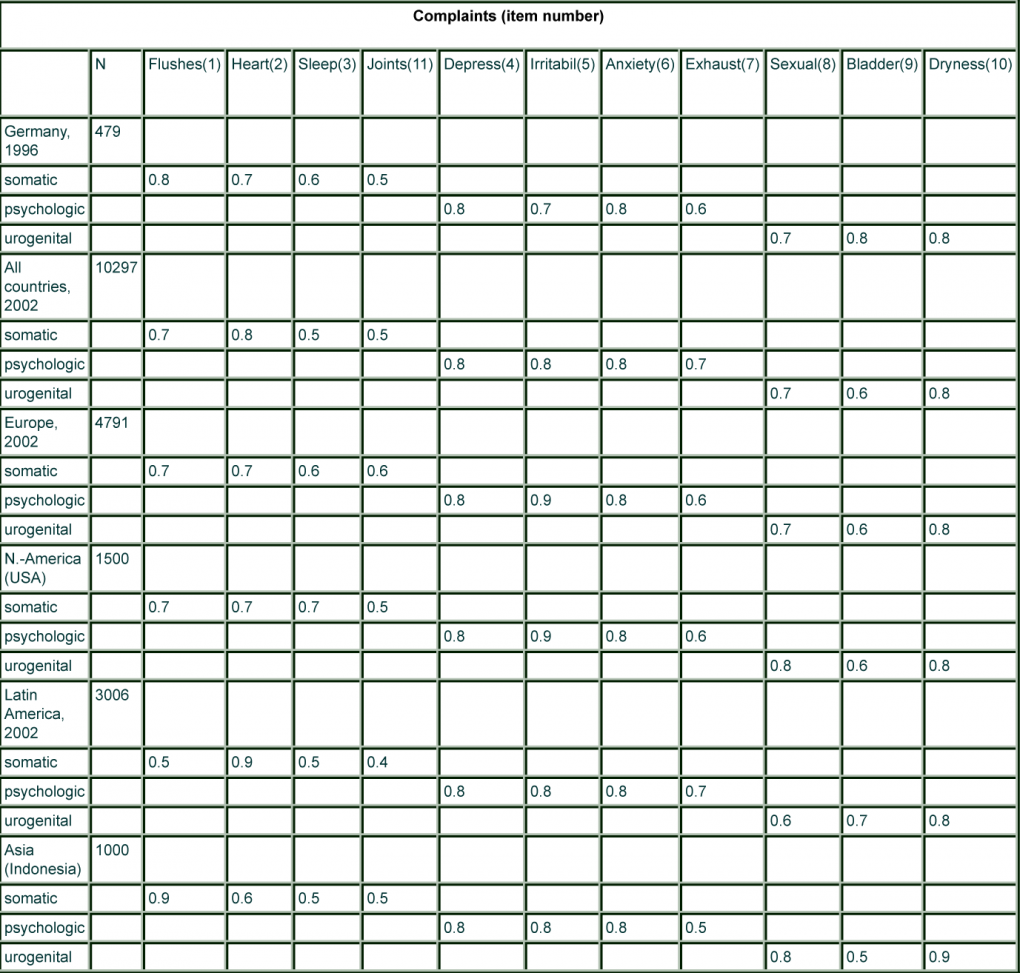
Similar results were seen for the individual countries of the respective regions. Although the prevalence of menopausal symptoms may slightly differ among regions/cultures (see later), the structure of complaints/symptoms seems similar. This suggests that the scale measures constantly the same phenomenon which speaks in favour of the translation/cultural adaptation of the scale.
However, there are also signals that the domains could be somewhat overlapping and not entirely independent as the statistical model promised.
The general agreement in the internal structure of the MRS scale across country groups, even accepting the possibility of slight differences in two items, suggests that the scale can very well be used in clinical studies in different countries, because intra-individual comparisons over time (before/after treatment) will be the main criterion which might not be affected by potential slight differences in the patient reported outcome structure.
2. Potthoff P, Heinemann LAJ, Schneider HPG, Rosemeier HP, Hauser GA. Menopause-Rating Skala (MRS): Methodische Standardisierung in der deutschen Bevölkerung. Zentralbl Gynakol 2000; 122:280-286.
9. Heinemann K, Assmann A, Möhner S, Schneider HPG, Heinemann LAJ. Reliabilität der Menopause-Rating-Skala (MRS). Untersuchung für die Deutsche Bevölkerung. Zentralbl Gynakol 2002; 124:161-163.
10. Schneider HPG, Heinemann LAJ, Rosemeier HP, Potthoff P, Behre HM. The Menopause Rating Scale (MRS): Reliability of scores of menopausal complaints. Climacteric 2000;3:59-64